 Catalogue PIGMA
Environment and Resources Authority
Type of resources
Available actions
Topics
Keywords
Contact for the resource
Provided by
Years
Formats
Representation types
-
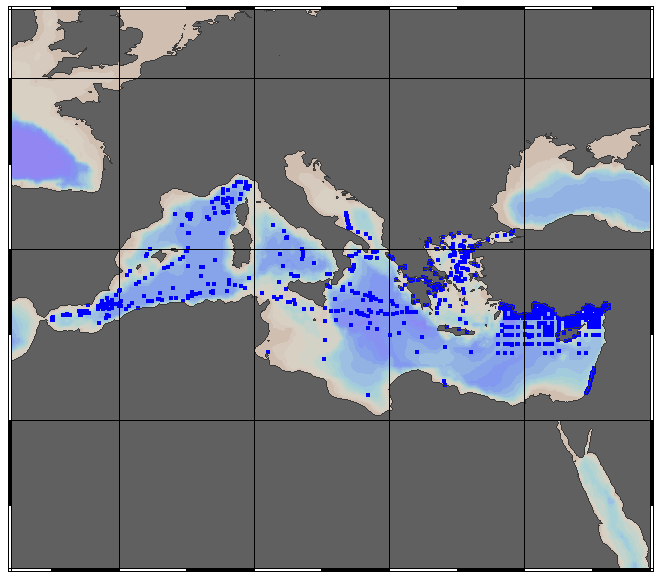
EMODnet Chemistry aims to provide access to marine chemistry data sets and derived data products concerning eutrophication, ocean acidification and contaminants. The chemicals chosen reflect importance to the Marine Strategy Framework Directive (MSFD). This regional aggregated dataset contains all unrestricted EMODnet Chemistry data on contaminants; temperature, salinity and additional sampling parameters are included when available. The spatial coverage is the Mediterranean Sea with 10917 CDI records divided per matrices: 3095 water profiles and 1385 water timeseries, 1511 sediment profiles and 4083 sediment timeseries, 42 biota profiles and 801 biota timeseries. In the water datasets, the vertical profiles temporal range is from 1974-09-12 to 2015-12-11 and the timeseries temporal range is from 2006-08-17 to 2018-04-26. In the sediment datasets, vertical profiles temporal range is from 1971-01-12 to 2016-04-07 and time series temporal range is from 1981-06-27 to 2018-12-14. For the biota datasets, vertical profiles temporal range is from 2008-05-05 to 2013-05-22 and time series temporal range is from 1979-03-29 to 2017-03-15. Data were harmonised and quality controlled by ‘Hellenic Centre for Marine Research, Hellenic National Oceanographic Data Centre (HCMR/HNODC)’ from Greece. Regional datasets concerning contaminants are automatically harvested. Parameter names in these datasets are based on P01, BODC Parameter Usage Vocabulary, which is available at: https://vocab.seadatanet.org/p01-facet-search. Each measurement value has a quality flag indicator. The resulting data collections for each Sea Basin are harmonised, and the collections are quality controlled by EMODnet Chemistry Regional Leaders using ODV Software and following a common methodology for all Sea Regions. Harmonisation means that: (1) unit conversion is carried out to express contaminant concentrations with a limited set of measurement units (according to EU directives 2013/39/UE; Comm. Dec. EU 2017/848) and (2) merging of variables described by different “local names” ,but corresponding exactly to the same concepts in BODC P01 vocabulary. Detailed documentation is available at: https://doi.org/10.6092/8b52e8d7-dc92-4305-9337-7634a5cae3f4 Explore and extract data at: https://emodnet-chemistry.webodv.awi.de/contaminants%3EMediterranean The harmonised dataset can also be downloaded as ODV spreadsheet (TXT file), which is composed of metadata header followed by tab separated values. This worksheet can be imported to ODV Software for visualisation (More information can be found at: https://www.seadatanet.org/Software/ODV ). The same dataset is offered also as TXT file in a long/vertical format, in which each P01 measurement is a record line. Additionally, there are a series of columns that split P01 terms in subcomponents (measure, substance, CAS number, matrix...).This transposed format is more adapted to worksheet applications users (e.g. LibreOffice Calc). The original datasets can be searched and downloaded from EMODnet Chemistry Chemistry CDI Data and Discovery Access Service: https://emodnet-chemistry.maris.nl/search
-
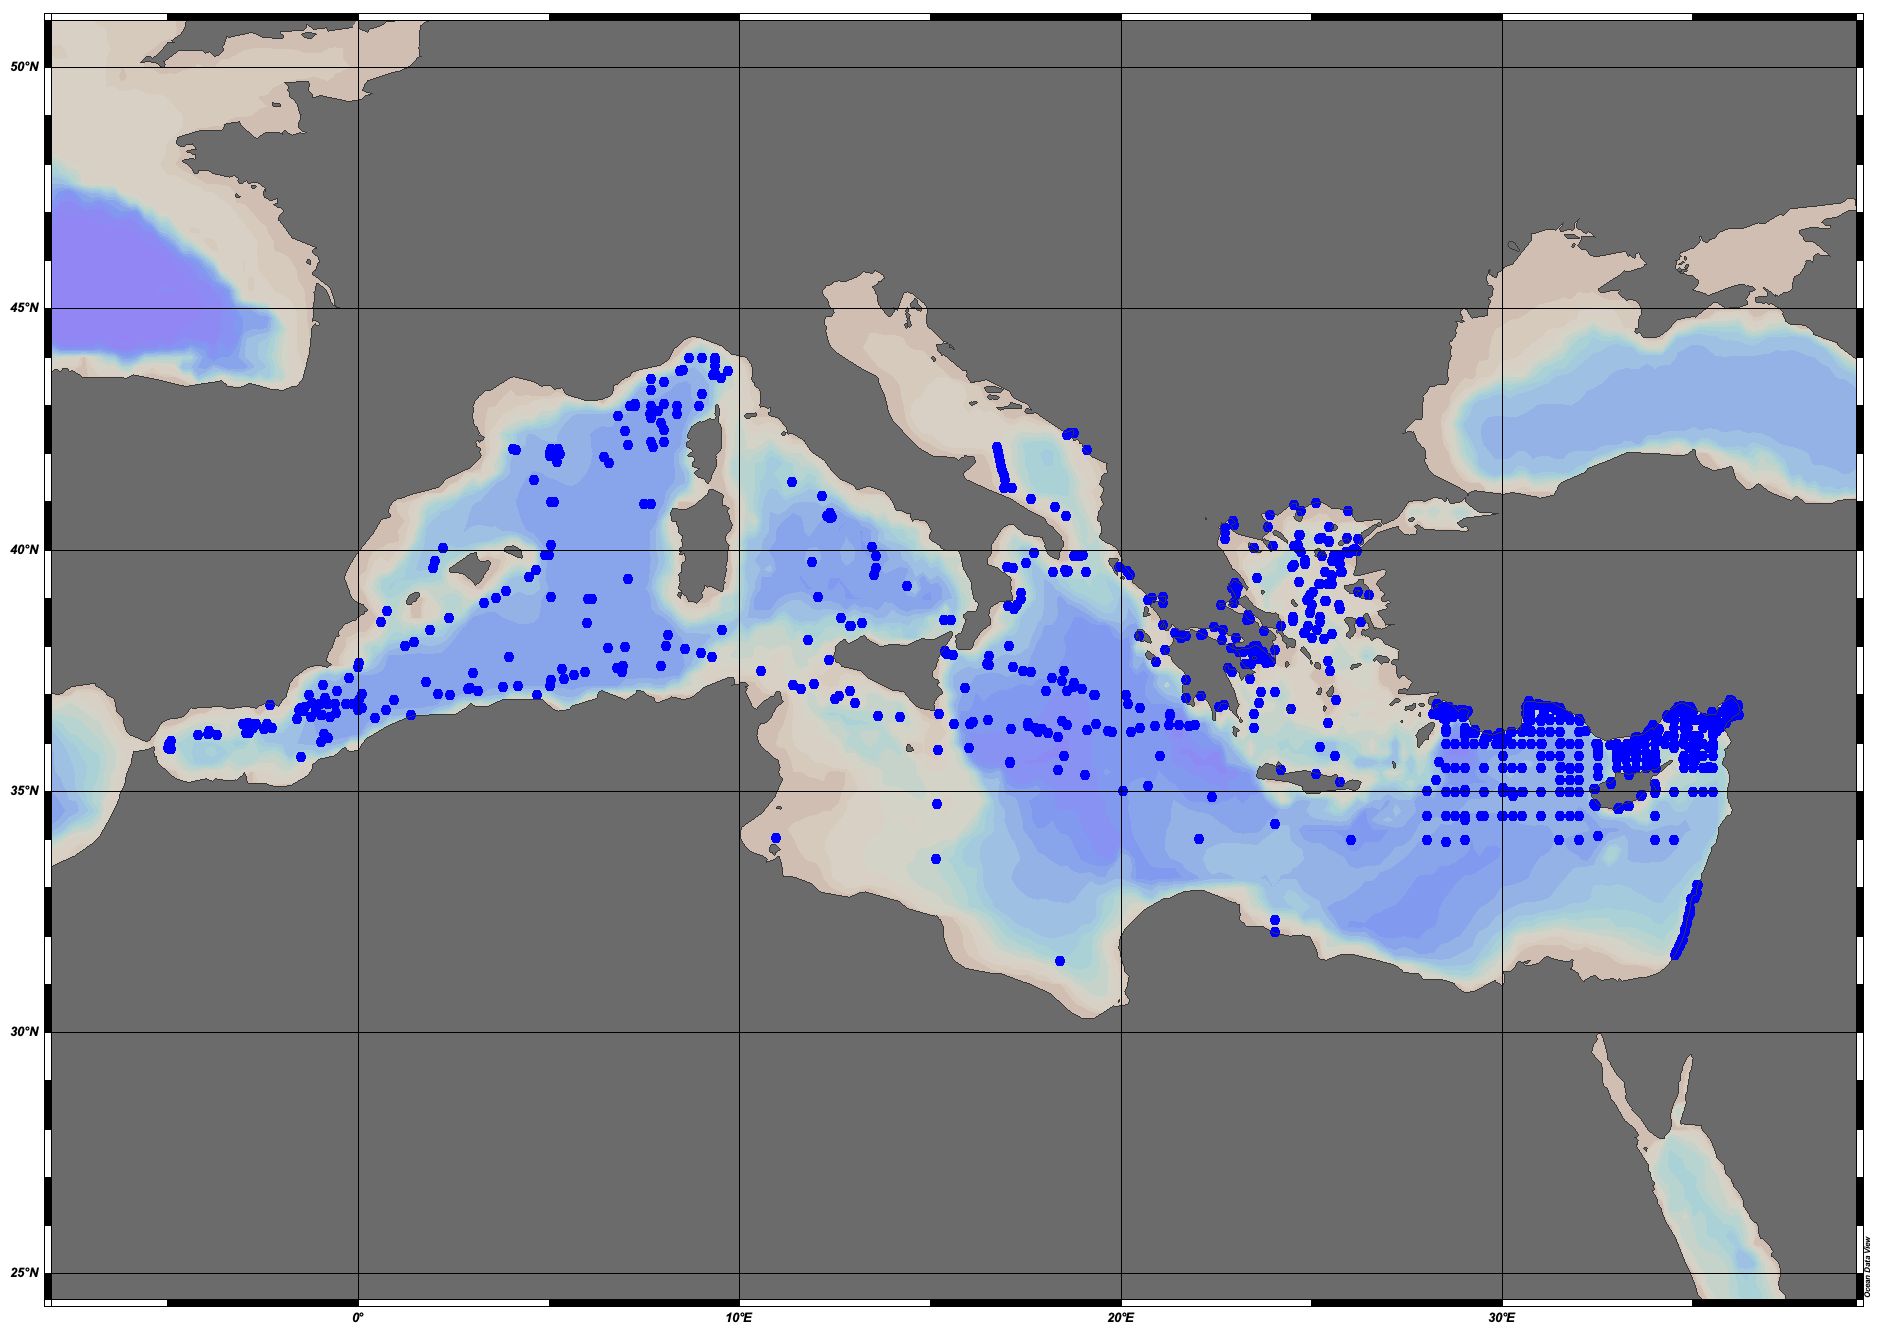
EMODnet Chemistry aims to provide access to marine chemistry data sets and derived data products concerning eutrophication, ocean acidification and contaminants. The chemicals chosen EMODnet Chemistry aims to provide access to marine chemistry datasets and derived data products concerning eutrophication, acidity and contaminants. The importance of the selected substances and other parameters relates to the Marine Strategy Framework Directive (MSFD). This aggregated dataset contains all unrestricted EMODnet Chemistry data on potential hazardous substances, despite the fact that some data might not be related to pollution (e.g. collected by deep corer). Temperature, salinity and additional parameters are included when available. It covers the Mediterranean Sea. Data were harmonised and validated by the ‘Hellenic Centre for Marine Research, Hellenic National Oceanographic Data Centre (HCMR/HNODC)’ in Greece. The dataset contains water, sediment and biota profiles and timeseries. The temporal coverage is 1974–2020 for water measurements, 1971–2020 for sediment measurements and 1979-2022 for biota measurements. Regional datasets concerning contaminants are automatically harvested and the resulting collections are harmonised and validated using ODV Software and following a common methodology for all sea regions ( https://doi.org/10.6092/8b52e8d7-dc92-4305-9337-7634a5cae3f4). Parameter names are based on P01 vocabulary, which relates to BODC Parameter Usage Vocabulary and is available at: https://vocab.nerc.ac.uk/search_nvs/P01/. The harmonised dataset can be downloaded as as an ODV spreadsheet, which is composed of a metadata header followed by tab separated values. This spreadsheet can be imported into ODV Software for visualisation (more information can be found at: https://www.seadatanet.org/Software/ODV). In addition, the same dataset is offered also as a txt file in a long/vertical format, in which each P01 measurement is a record line. Additionally, there are a series of columns that split P01 terms into subcomponents (substance, CAS number, matrix...).This transposed format is more adapted to worksheet applications (e.g. LibreOffice Calc).
-

EMODnet Chemistry aims to provide access to marine chemistry data sets and derived data products concerning eutrophication, ocean acidification and contaminants. The chemicals chosen EMODnet Chemistry aims to provide access to marine chemistry datasets and derived data products concerning eutrophication, acidity and contaminants. The importance of the selected substances and other parameters relates to the Marine Strategy Framework Directive (MSFD). This aggregated dataset contains all unrestricted EMODnet Chemistry data on potential hazardous substances, despite the fact that some data might not be related to pollution (e.g. collected by deep corer). Temperature, salinity and additional parameters are included when available. It covers the Mediterranean Sea. Data were harmonised and validated by the ‘Hellenic Centre for Marine Research, Hellenic National Oceanographic Data Centre (HCMR/HNODC)’ in Greece. The dataset contains water, sediment and biota profiles and timeseries. The temporal coverage is 1974–2020 for water measurements, 1971–2020 for sediment measurements and 1979-2021 for biota measurements. Regional datasets concerning contaminants are automatically harvested and the resulting collections are harmonised and validated using ODV Software and following a common methodology for all sea regions ( https://doi.org/10.6092/8b52e8d7-dc92-4305-9337-7634a5cae3f4). Parameter names are based on P01 vocabulary, which relates to BODC Parameter Usage Vocabulary and is available at: https://vocab.nerc.ac.uk/search_nvs/P01/. The harmonised dataset can be downloaded as as an ODV spreadsheet, which is composed of a metadata header followed by tab separated values. This spreadsheet can be imported into ODV Software for visualisation (more information can be found at: https://www.seadatanet.org/Software/ODV). In addition, the same dataset is offered also as a txt file in a long/vertical format, in which each P01 measurement is a record line. Additionally, there are a series of columns that split P01 terms into subcomponents (substance, CAS number, matrix...).This transposed format is more adapted to worksheet applications (e.g. LibreOffice Calc).
-
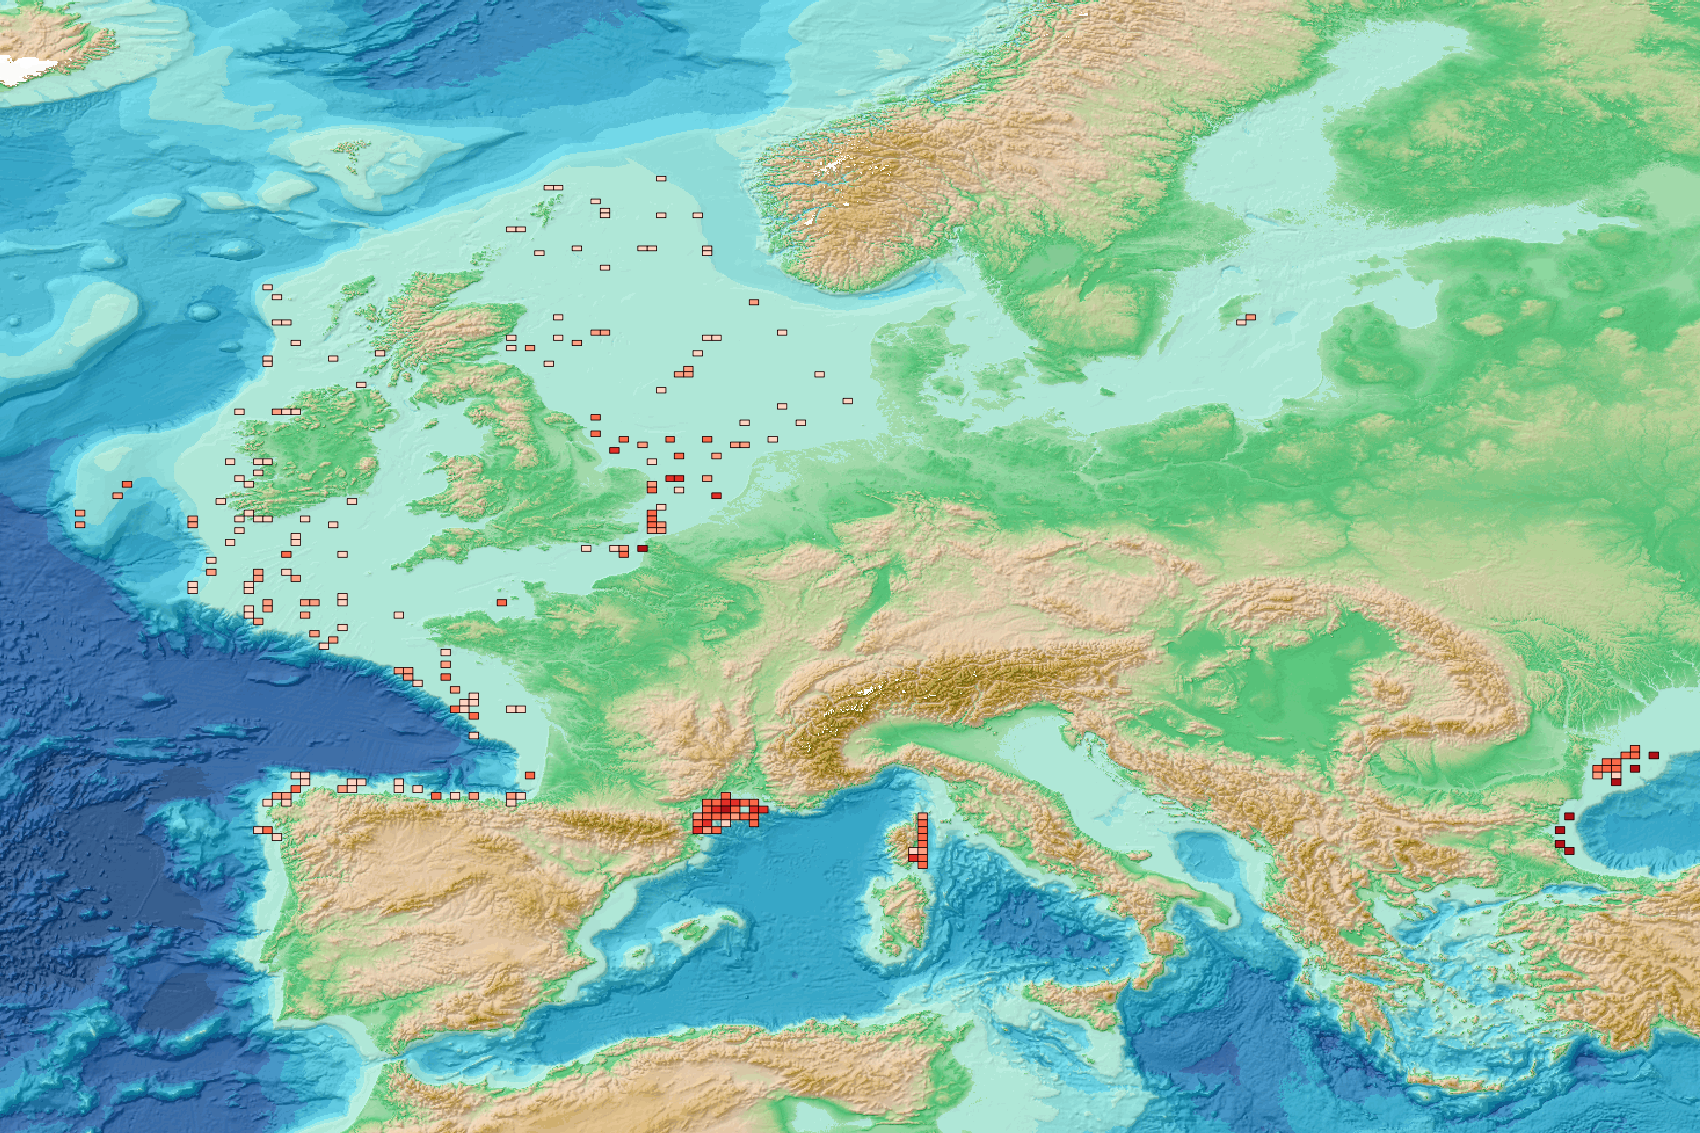
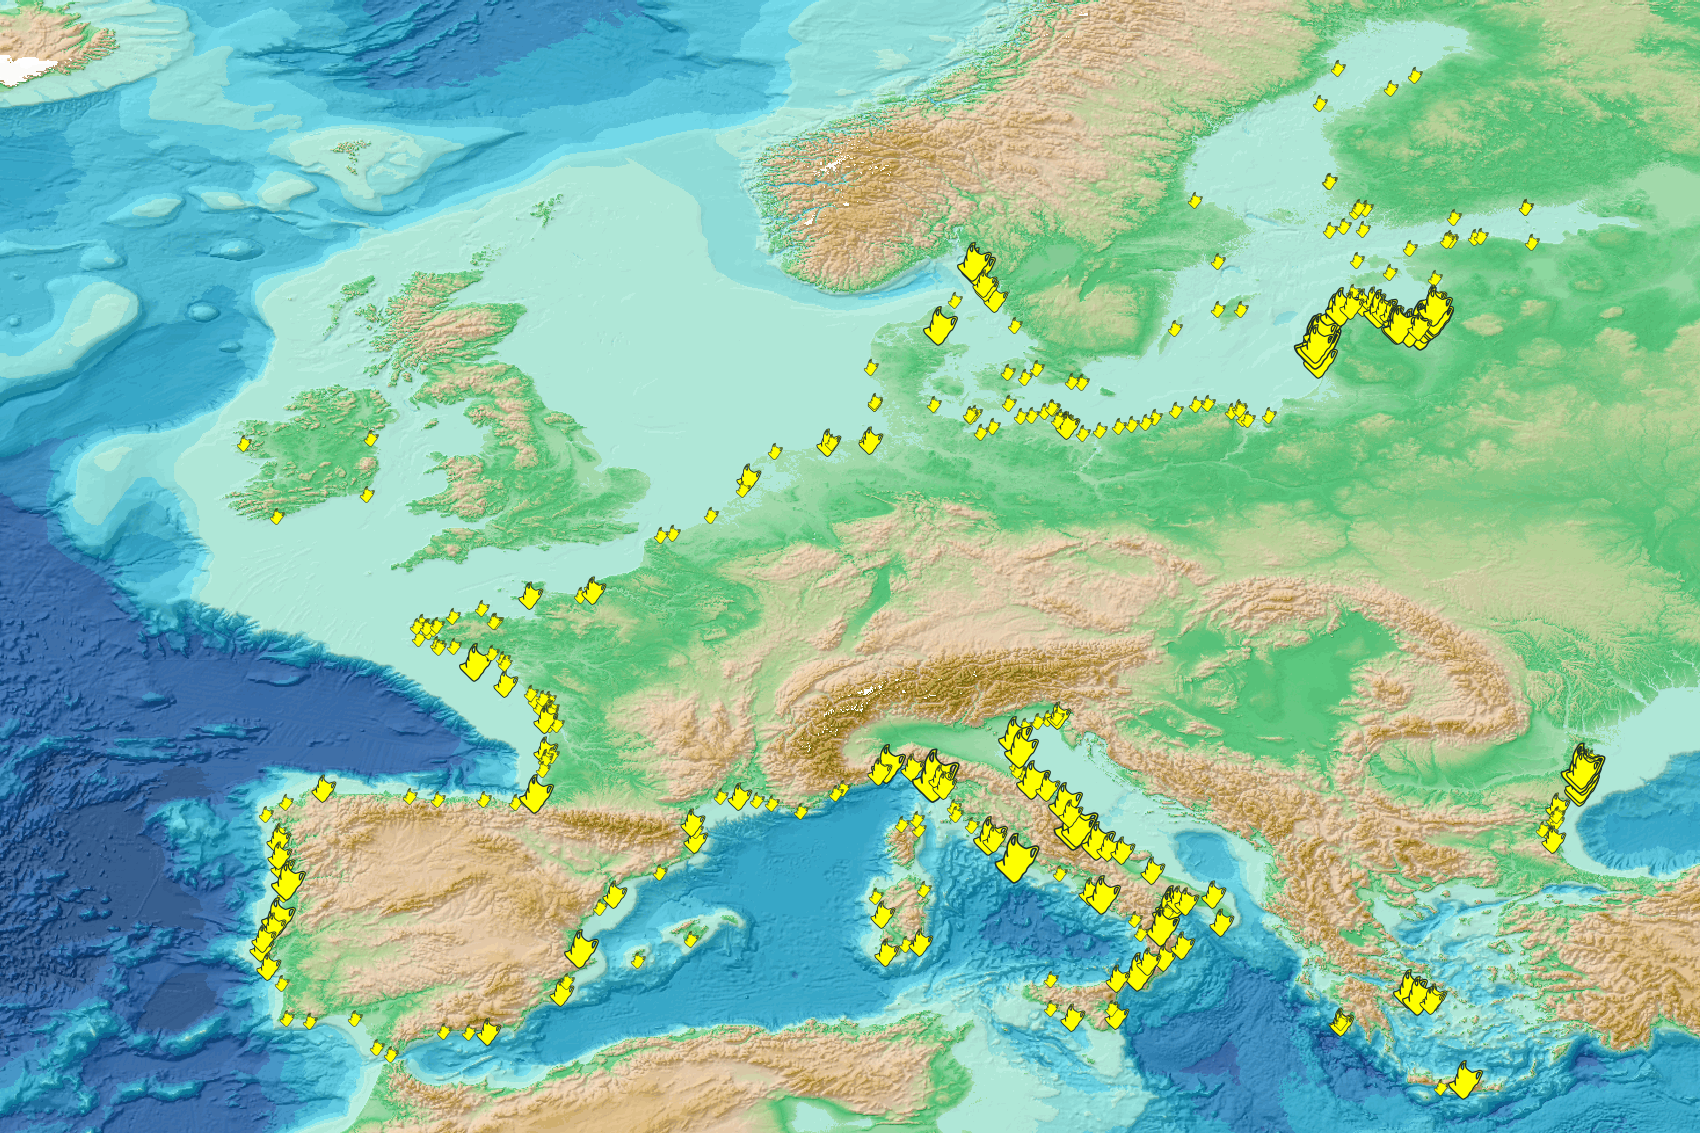
This visualization product displays the number of Marine Strategy Framework Directive (MSFD) monitoring surveys and the associated temporal coverage per beach. EMODnet Chemistry included the collection of marine litter in its 3rd phase. Since the beginning of 2018, data of beach litter have been gathered and processed in the EMODnet Chemistry Marine Litter Database (MLDB). The harmonization of all the data has been the most challenging task considering the heterogeneity of the data sources, sampling protocols and reference lists used on a European scale. Preliminary processing were necessary to harmonize all the data: - Exclusion of OSPAR 1000 protocol: in order to follow the approach of OSPAR that it is not including these data anymore in the monitoring; - Selection of MSFD surveys only (exclusion of other monitoring, cleaning and research operations); - Exclusion of beaches without coordinates. More information is available in the attached documents. Warning: the absence of data on the map doesn't necessarily mean that they don't exist, but that no information has been entered in the Marine Litter Database for this area.
-
This visualization product displays fishing related items density per trawl. EMODnet Chemistry included the collection of marine litter in its 3rd phase. Since the beginning of 2018, data of seafloor litter collected by international fish-trawl surveys have been gathered and processed in the EMODnet Chemistry Marine Litter Database (MLDB). The harmonization of all the data has been the most challenging task considering the heterogeneity of the data sources, sampling protocols (OSPAR and MEDITS protocols) and reference lists used on a European scale. Moreover, within the same protocol, different gear types are deployed during fishing bottom trawl surveys. In cases where the wingspread and/or the number of items were unknown, data could not be used because these fields are needed to calculate the density. Data collected before 2011 are affected by this filter. When the distance reported in the data was null, it was calculated from: - the ground speed and the haul duration using this formula: Distance (km) = Haul duration (h) * Ground speed (km/h); - the trawl coordinates if the ground speed and the haul duration were not filled in. The swept area is calculated from the wingspread (which depends on the fishing gear type) and the distance trawled: Swept area (km²) = Distance (km) * Wingspread (km) Densities have been calculated on each trawl using the following computation: Density of fishing related items (number of items per km²) = ∑Number of fishing related items / Swept area (km²) Percentiles 50, 75, 95 & 99 have been calculated taking into account data for all years. The list of selected items for this product is attached to this metadata. Information on data processing and calculation is detailed in the attached methodology document. Warning: the absence of data on the map doesn't necessarily mean that they don't exist, but that no information has been entered in the Marine Litter Database for this area.
-
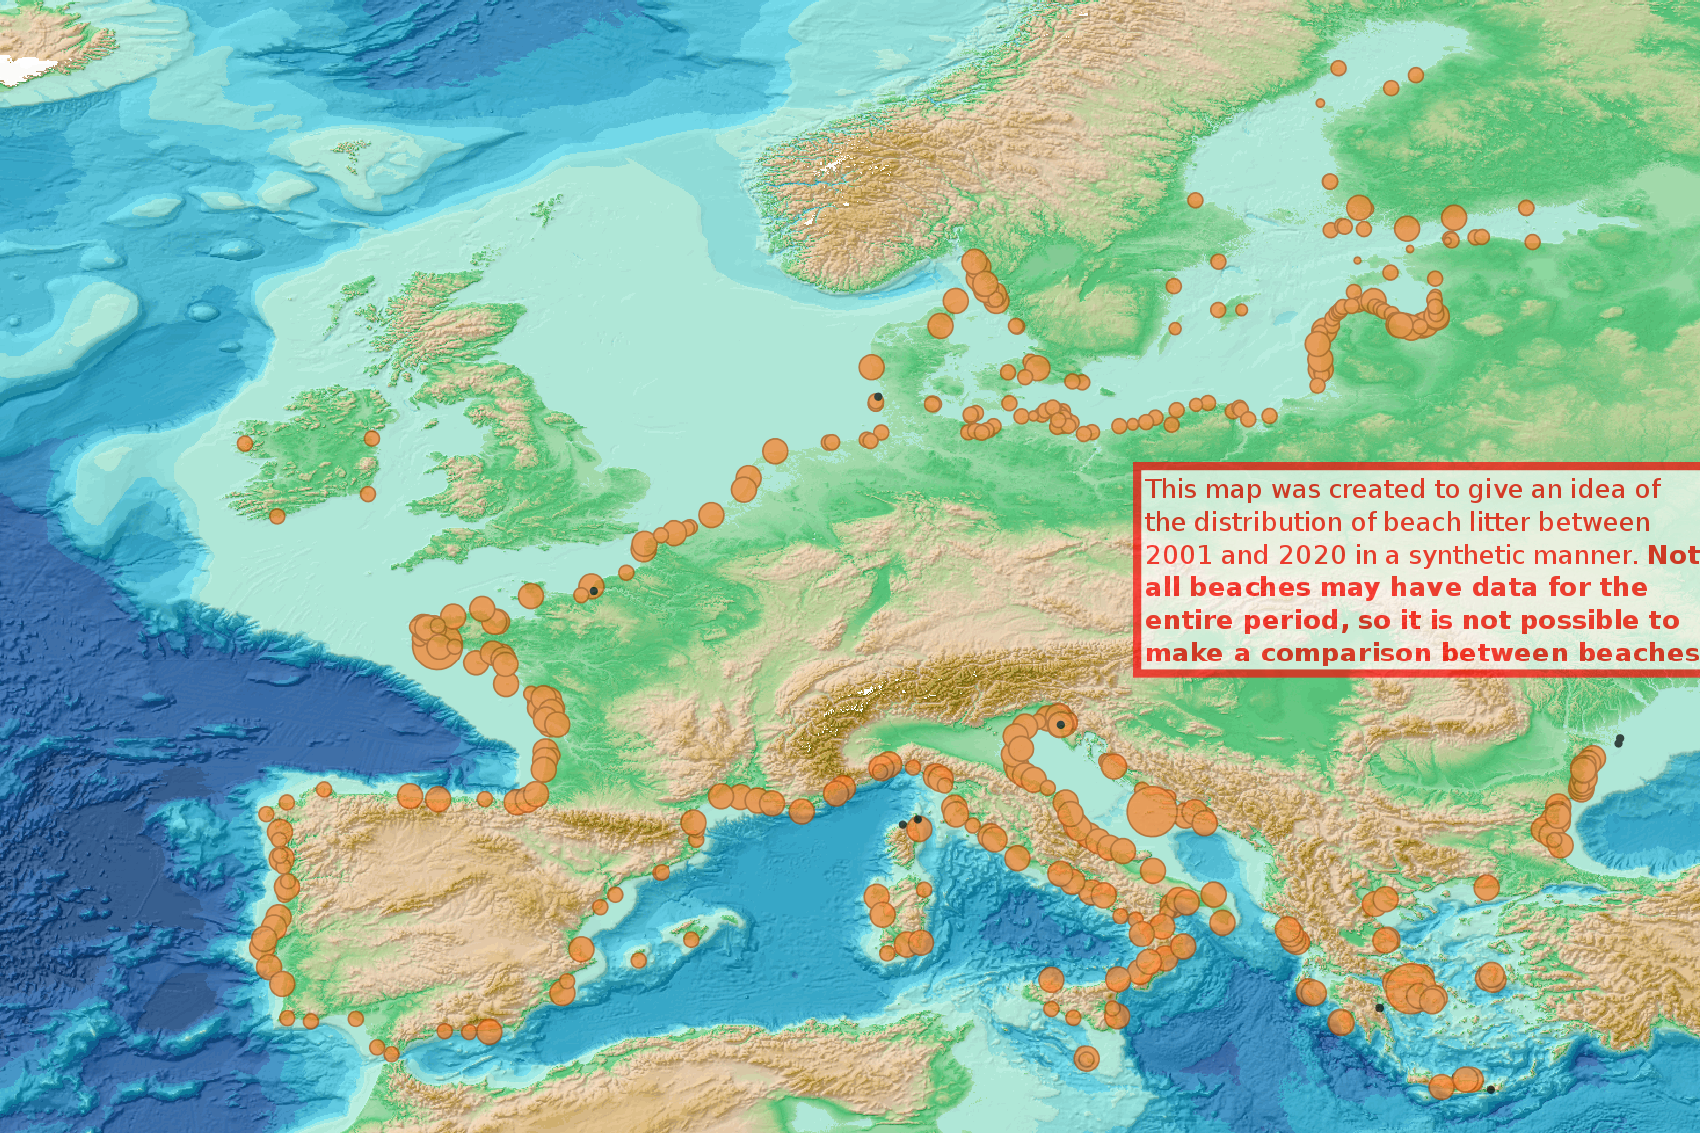
This visualization product displays the total abundance of marine macro-litter (> 2.5cm) per beach, per 100m & to 1 survey aggregated over the period 2001 to 2020 from Marine Strategy Framework Directive (MSFD) monitoring surveys. EMODnet Chemistry included the collection of marine litter in its 3rd phase. Since the beginning of 2018, data of beach litter have been gathered and processed in the EMODnet Chemistry Marine Litter Database (MLDB). The harmonization of all the data has been the most challenging task considering the heterogeneity of the data sources, sampling protocols and reference lists used on a European scale. Preliminary processing were necessary to harmonize all the data: - Exclusion of OSPAR 1000 protocol: in order to follow the approach of OSPAR that it is not including these data anymore in the monitoring; - Selection of MSFD surveys only (exclusion of other monitoring, cleaning and research operations); - Exclusion of beaches without coordinates; - Some categories & some litter types like organic litter, small fragments (paraffin and wax; items > 2.5cm) and pollutants have been removed. The list of selected items is attached to this metadata (total abundance list). This list was created using EU Marine Beach Litter Baselines and EU Threshold Value for Macro Litter on Coastlines from JRC (these two documents are attached to this metadata); - Normalization of survey lengths to 100m & 1 survey / year: in some cases, the survey length was not exactly 100m, so in order to be able to compare the abundance of litter from different beaches a normalization is applied using this formula: Number of items (normalized by 100 m) = Number of litter per items x (100 / survey length) Then, this normalized number of items is summed to obtain the total normalized number of litter for each survey. Finally, a median is calculated over the entire period among all these total numbers of litter per 100m calculated for each survey. Sometimes the survey length was null or equal to 0. Assuming that the MSFD protocol has been applied, the length has been set at 100m in these cases. The size of each circle on this map increases with the calculated median number of marine litter per beach, per 100m & to 1 survey. The median litter abundance values displayed in the legend correspond to the 50 and 99 percentiles and the maximum value. More information is available in the attached documents. Warning: - the absence of data on the map doesn't necessarily mean that they don't exist, but that no information has been entered in the Marine Litter Database for this area. - This map was created to give an idea of the distribution of beach litter between 2001 and 2021 in a synthetic manner. NOT ALL BEACHES MAY HAVE DATA FOR THE ENTIRE PERIOD, SO IT IS NOT POSSIBLE TO MAKE A COMPARISON BETWEEN BEACHES.
-
This visualization product displays plastic bags density per trawl. EMODnet Chemistry included the collection of marine litter in its 3rd phase. Since the beginning of 2018, data of seafloor litter collected by international fish-trawl surveys have been gathered and processed in the EMODnet Chemistry Marine Litter Database (MLDB). The harmonization of all the data has been the most challenging task considering the heterogeneity of the data sources, sampling protocols (OSPAR and MEDITS protocols) and reference lists used on a European scale. Moreover, within the same protocol, different gear types are deployed during fishing bottom trawl surveys. In cases where the wingspread and/or number of items were unknown, data could not be used because these fields are needed to calculate the density. Data collected before 2011 are affected by this filter. When the distance reported in the data was null, it was calculated from: - the ground speed and the haul duration using this formula: Distance (km) = Haul duration (h) * Ground speed (km/h); - the trawl coordinates if the ground speed and the haul duration were not filled in. The swept area is calculated from the wingspread (which depends on the fishing gear type) and the distance trawled: Swept area (km²) = Distance (km) * Wingspread (km) Densities have been calculated on each trawl and year using the following computation: Density of plastic bags (number of items per km²) = ∑Number of plastic bags related items / Swept area (km²) Percentiles 50, 75, 95 & 99 have been calculated taking into account data for all years. The list of selected items for this product is attached to this metadata. Information on data processing and calculation is detailed in the attached methodology document. Warning: the absence of data on the map doesn't necessarily mean that they don't exist, but that no information has been entered in the Marine Litter Database for this area.
-
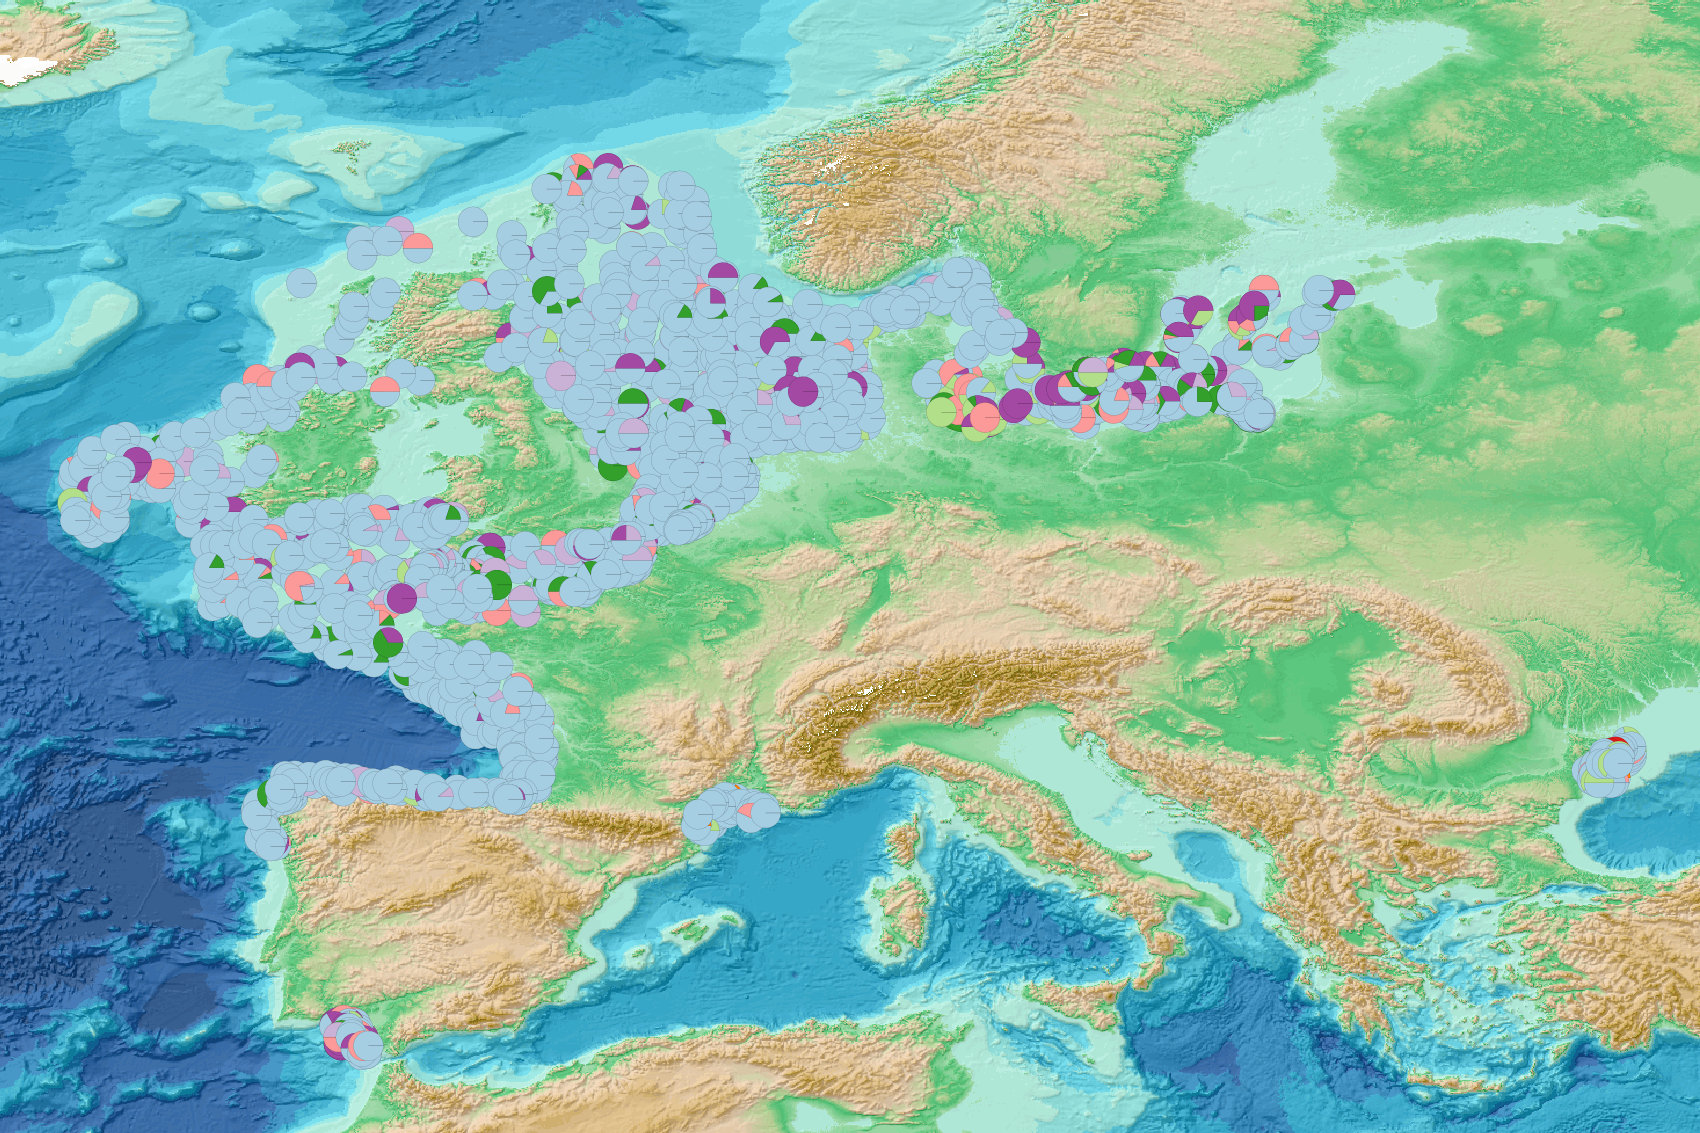
This visualization product displays the marine litter material categories percentage per trawl. EMODnet Chemistry included the collection of marine litter in its 3rd phase. Since the beginning of 2018, data of seafloor litter collected by international fish-trawl surveys have been gathered and processed in the EMODnet Chemistry Marine Litter Database (MLDB). The harmonization of all the data has been the most challenging task considering the heterogeneity of the data sources, sampling protocols (OSPAR and MEDITS protocols) and reference lists used on a European scale. Moreover, within the same protocol, different gear types are deployed during fishing bottom trawl surveys. Unlike other EMODnet seafloor litter products, all trawls surveyed since 2007 are included in this map even if the wingspread and/or the distance are unknown. Only surveys with an unknown number of items were excluded from this product. Harmonization of the material categories between ICES and MEDITS lists has been performed and the following calculation has been applied: Material % = (∑Number of items of each material category*100)/(∑Number of items of all material categories) More information on data processing and calculation are detailed in the document attached. Warning: the absence of data on the map doesn't necessarily mean that they don't exist, but that no information has been entered in the Marine Litter Database for this area.
-
This visualization product displays the spatial distribution of plastic bags density per trawl. EMODnet Chemistry included the collection of marine litter in its 3rd phase. Since the beginning of 2018, data of seafloor litter collected by international fish-trawl surveys have been gathered and processed in the EMODnet Chemistry Marine Litter Database (MLDB). The harmonization of all the data has been the most challenging task considering the heterogeneity of the data sources, sampling protocols (OSPAR and MEDITS protocols) and reference lists used on a European scale. Moreover, within the same protocol, different gear types are deployed during fishing bottom trawl surveys. In cases where the wingspread and/or number of items were unknown, data could not be used because these fields are needed to calculate the density. Data collected before 2011 are affected by this filter. When the distance reported in the data was null, it was calculated from: - the ground speed and the haul duration using this formula: Distance (km) = Haul duration (h) * Ground speed (km/h); - the trawl coordinates if the ground speed and the haul duration were not filled in. The swept area is calculated from the wingspread (which depends on the fishing gear type) and the distance trawled: Swept area (km²) = Distance (km) * Wingspread (km) Densities have been calculated on each trawl and year using the following computation: Density of plastic bags (number of items per km²) = ∑Number of plastic bags related items / Swept area (km²) Then a grid with 30km x 30km cells is used to calculate the weighted mean of densities in each cell from the formula : Weighted mean (number of items per km²) = ∑ (Distance (km) * Density (number of items per km²)) / ∑ Distance (km) Percentiles 50, 75, 95 & 99 have been calculated taking into account data for all years. More information on data processing and calculation are detailed in the document attached. Warning: the absence of data on the map doesn't necessarily mean that they don't exist, but that no information has been entered in the Marine Litter Database for this area. This work is based on the work presented in the following scientific article: O. Gerigny, M. Brun, M.C. Fabri, C. Tomasino, M. Le Moigne, A. Jadaud, F. Galgani, Seafloor litter from the continental shelf and canyons in French Mediterranean Water: Distribution, typologies and trends, Marine Pollution Bulletin, Volume 146, 2019, Pages 653-666, ISSN 0025-326X, https://doi.org/10.1016/j.marpolbul.2019.07.030.
-
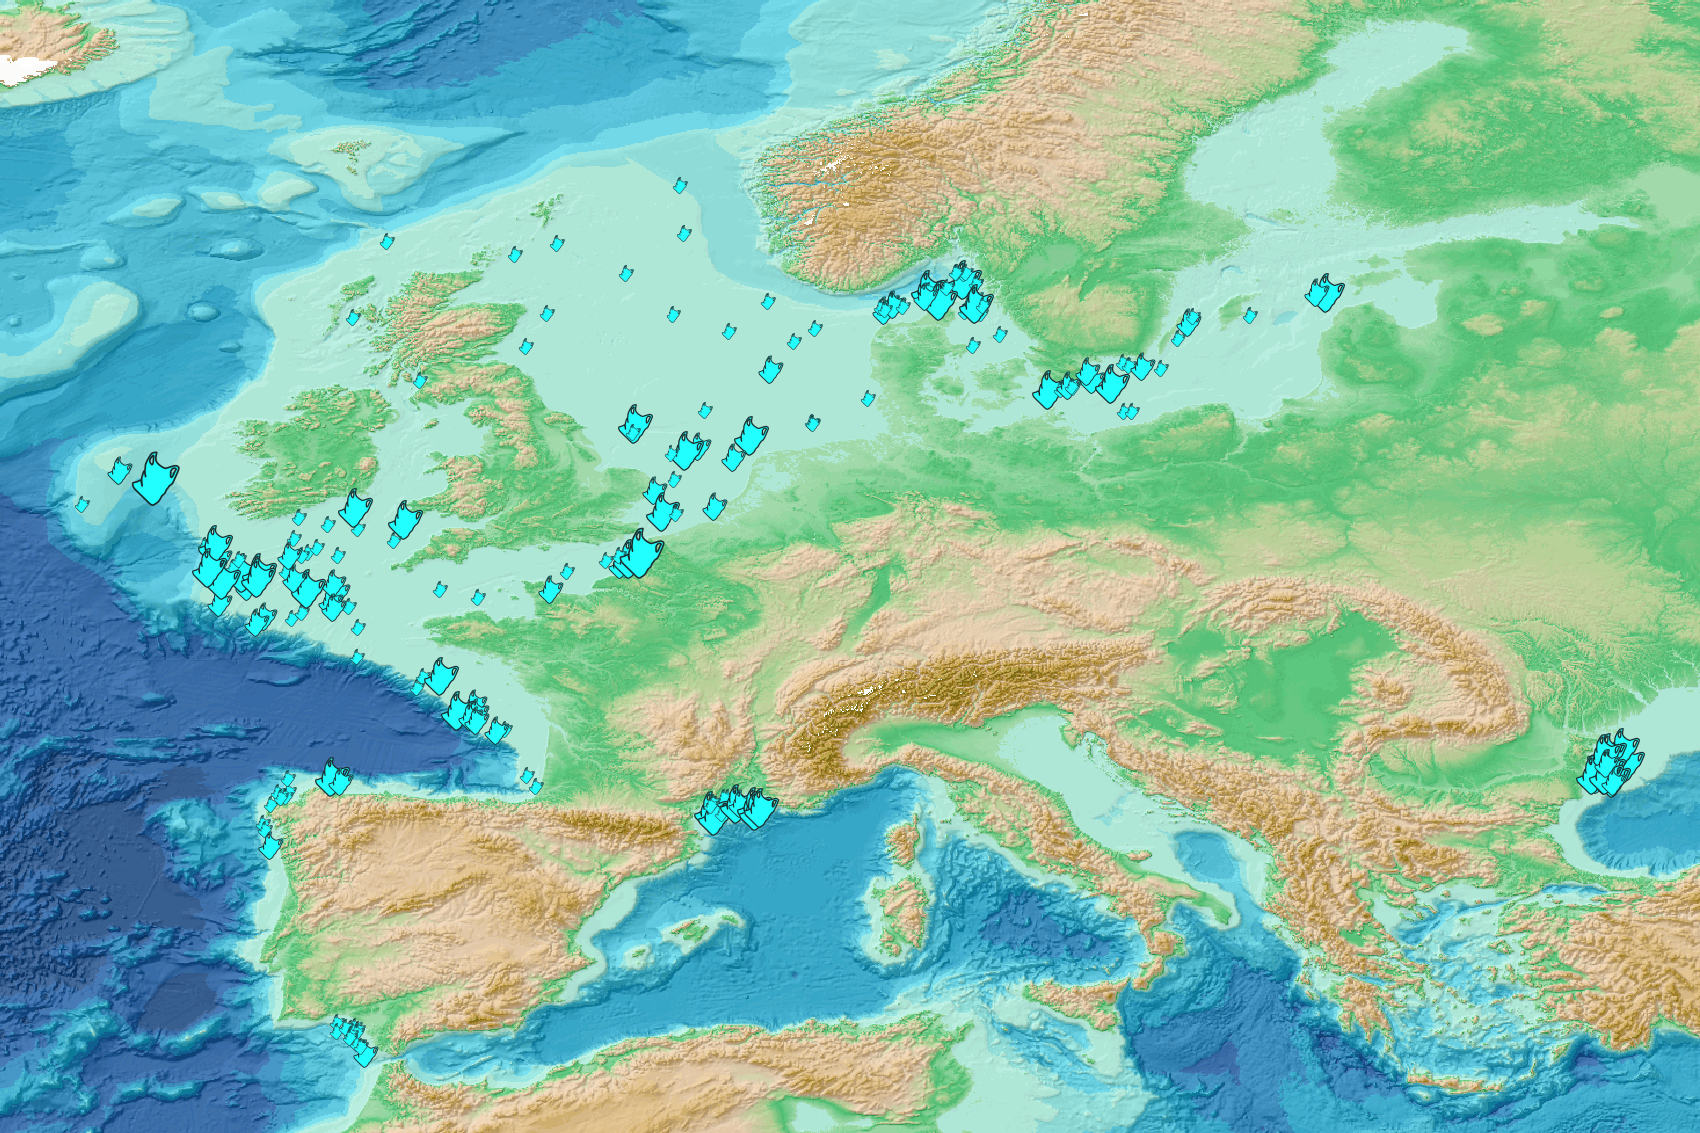
This visualization product displays the plastic bags abundance of marine macro-litter (> 2.5cm) per beach per year from Marine Strategy Framework Directive (MSFD) monitoring surveys. EMODnet Chemistry included the collection of marine litter in its 3rd phase. Since the beginning of 2018, data of beach litter have been gathered and processed in the EMODnet Chemistry Marine Litter Database (MLDB). The harmonization of all the data has been the most challenging task considering the heterogeneity of the data sources, sampling protocols and reference lists used on a European scale. Preliminary processing were necessary to harmonize all the data: - Exclusion of OSPAR 1000 protocol: in order to follow the approach of OSPAR that it is not including these data anymore in the monitoring; - Selection of MSFD surveys only (exclusion of other monitoring, cleaning and research operations); - Exclusion of beaches without coordinates; - Selection of plastic bags related items only. The list of selected items is attached to this metadata. This list was created using EU Marine Beach Litter Baselines and EU Threshold Value for Macro Litter on Coastlines from JRC (these two documents are attached to this metadata); - Normalization of survey lengths to 100m & 1 survey / year: in some case, the survey length was not exactly 100m, so in order to be able to compare the abundance of litter from different beaches a normalization is applied using this formula: Number of plastic bags related items of the survey (normalized by 100 m) = Number of plastic bags related items of the survey x (100 / survey length) Then, this normalized number of plastic bags related items is summed to obtain the total normalized number of plastic bags related items for each survey. Finally, the median abundance of plastic bags related items for each beach and year is calculated from these normalized abundances of plastic bags related items per survey. Sometimes the survey length was null or equal to 0. Assuming that the MSFD protocol has been applied, the length has been set at 100m in these cases. Percentiles 50, 75, 95 & 99 have been calculated taking into account plastic bags related items from MSFD data for all years. More information is available in the attached documents. Warning: the absence of data on the map doesn't necessarily mean that they don't exist, but that no information has been entered in the Marine Litter Database for this area.